How does the sweetness of a sweetener change at different ph and temperatures?
Sweeteners, i.e., substances that impart sweetness to foods, stimulate sweetness by binding to the sweetness receptors T1R2 and T1R3. According to the nutritional value of sweeteners and sweetness potency (i.e., relative sweetness) is divided into nutritive sweeteners and non-nutritive sweeteners.
Nutritive sweeteners, including sugars and sugar alcohols, such as sugars such as maltose syrup, fructose syrup, etc., can provide more energy, high glycemic index; sugar alcohols lower calories, sweetness is also slightly inferior to sucrose; non-nutritive sweeteners have natural and artificial points, of which the natural sweetener stevioside in recent years by the food industry to be widely promoted, is the stevia and tetracyclic diterpene mixture, but due to the existence of its bitterness, astringent taste and However, due to its defects such as bitter taste, astringent taste and low lasting sweetness, its application is limited.
Currently, the application of sweeteners is mainly concentrated in the confectionery, flavored beverage and dairy industries, covering a wide range of food systems such as acidic and neutral, room temperature and low temperature. According to research reports, different application conditions may affect the sensory characteristics of different sweeteners.
Yoshinaka et al. added succinic acid and salts to sucralose solution to mask the off-flavor, but also found that the addition of succinic acid affected the sweetness characteristics and sweetness of the solution. In a study of chocolate milk beverages with different sweeteners, it was found that the sweetness of samples with sucralose and steviol glycosides decreased slightly as the temperature of the beverages increased, but there was no significant pattern in the effect of temperature as the composition of the samples changed.
With regard to the study of sweetness dynamic release characteristics of sweeteners, the most common evaluation method is the time-intensity (TI) method, which can characterize the intensity change of single or multiple attributes of the samples to be tested in the time dimension, and it has been widely used in the screening of samples about sweeteners in different food systems.
In order to effectively assess the sweetness dynamic release characteristics of sweeteners, seven sweeteners with less overall off-flavors and sweetness characteristics close to sucrose were screened through the preliminary study, namely, fructose syrup, maltitol, sorbitol, oligofructose, steviol glycosides 00, steviol glycosides 07, and steviol glycosides 14, and each of them was determined to be isosweetened with 5 g/dL sucrose under neutral conditions at room temperature through a series of sensory evaluation methods. Sweeteners added mass concentration, and then through the time-intensity method to collect samples in different conditions of sweetness dynamic performance, according to reveal the influence of pH and temperature on the sweetness dynamic release characteristics of each sweetener law.
Materials and Methods
I. Experimental materials
Nutritive sweeteners (sucrose, fructose syrup, maltitol, sorbitol), non-nutritive sweeteners (stevioside 00 (73.30% RebA, 18.05% RebD), stevioside 07 (58.54% RebD, 33.91% RebA), stevioside 14 (86.35% RebM, 6.5% RebD)).
II.Determination of isosweet mass concentration of samples
The sweetness ratios of the given sweeteners could be approximately determined by reviewing the literature (see Table 1). First, a series of mass concentrations of samples were prepared at ambient temperature (25°C) using a sucrose solution at a mass concentration of 5 g/dL as a reference sample and the sweetness ratios of the seven given sweeteners as a reference. The mass concentration of each sweetener that was similar to the reference sample was first selected by pairwise comparison, and then adjusted to an exact mass concentration by quantile estimation to ensure that the sweetness scores of the sweeteners at that mass concentration were not significantly different from those of the sucrose reference samples after ANOVA analysis (analysis of variance). The ratio of this sucrose mass concentration to the sweetener mass concentration is the relative sweetness of the sweetener.

Time-intensity curve plotting
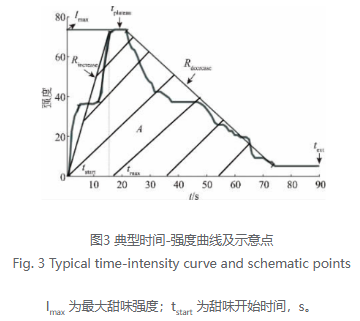
In this study, SensoMaker 1.92 software was used to collect time-intensity data, and the evaluator opened the software and entered the interface shown in Figure 1. Each sample was evaluated within 60 s. Clicking the start button, the mouse was placed to start drinking the sample from 0 s (green) and dragging the cursor on the scale, with 0 indicating no perception and 10 indicating extreme perception of the attribute, and then swallowing it after 5 s. When the sweetness disappeared, the cursor was dragged back to 0. After the 60 s timing was completed, the automatically generated file recorded the instantaneous sweetness per second and was automatically rounded to get a curve about the sample’s The final result is a curve of the sweetness of the sample over time, i.e., a time-intensity curve.

IV. Establishment of the evaluation team
After the questionnaire survey, 80 students (17-21 years old) who were interested in sweetener beverages and had certain consumption habits were screened out from the applicants of sensory evaluators at Jiangnan University, and then a group of evaluators (11 females and 1 male) were finally recruited by screening candidates with higher sensitivity through tests such as basic taste identification and triangular test, and by further assessing the language expression ability.
After the group was formed, the pre-training of about 50 h was aimed at improving the evaluators’ ability in sweet taste identification and intensity scoring as well as their proficiency in plotting sweet taste time-intensity curves using the SensoMaker 1.92 software, and after the training, the data of the eight evaluators with better performance were selected.
The evaluators were assessed by PanelCheckV1.4.2, and as shown in Figure 2, the F-values of this evaluation group exceeded the 5% significance level for the focal parameters (text, Rincrease, Rdecrease, and A), which indicates a better ability to differentiate; the repeatability, except for a slightly higher MSE for the A-value, and most of the other parameter MSEs stabilized at less than 1.0, which indicates a better repeatability.
The evaluator was assessed by Pane1checkV1.4.2, as shown in Figure 2, the F-value of this evaluation group exceeded the 5% significance level on the focus parameters (text, Rdecrease and A), indicating a strong ability to differentiate:Repeatability except for the MSE of the A value which was slightly higher, most of the other parameter MSE values were stabilized below 1.0, which indicates a good repeatability.
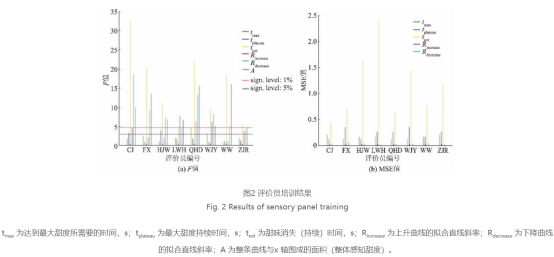
In the assessment, the evaluator was sequentially provided with 10 cups of differently coded samples, and each sample was consumed at 15mL and swallowed after 5 s. Care was taken to adequately cleanse the mouth with purified water and soda crackers between samples and to ensure that there was a 5-min interval between samples, and each sample was repeated 2 times.
V. Time-intensity curve dynamic analysis
The dynamic analysis of time-intensity was mainly processed using XLSTAT2019.2.2. Firstly, ANOVA was used in determining the sweetness concentration of the sweetener isotope; secondly, the results of the sweetness dynamic evaluation of different samples by different evaluators were processed by XLSTAT2019.2.2 to make the time-intensity curves (see Fig. 3). The parameters of the curves were analyzed by principal component analysis (PCA analysis) and cluster analysis (AHC analysis) to determine the dynamic performance of each sample or class of samples.
Results and analysis
I. Determination of isosweet mass concentration and relative sweetness of samples
The mass concentration of other sweeteners that are comparable to the sweetness of 5g/dL sucrose solution at room temperature was determined by pairwise comparison method and quantitative estimation method, and then the relative sweetness was obtained by the ratio of the mass concentration of sucrose to the mass concentration of sweeteners.

II. Time-intensity curve analysis of different sweeteners in each system
Each sweetener solution was prepared according to the obtained isosweet mass concentration, three system solutions were prepared according to the requirements, the evaluator tasted and plotted, the raw data were collected and analyzed by XLSTAT2019.2.2, and the dynamic fitting curves of sucrose and the seven sweeteners solutions in different systems were obtained (see Fig. 4) and the values of each parameter corresponding to the curves (see Table 3).


In terms of maximum sweetness intensity, fructose syrup and steviol glycosides samples decreased more significantly in acidic conditions than in low-temperature conditions, whereas sugar alcohols, sucrose and oligofructose decreased more significantly in low-temperature conditions than in acidic conditions; at the same time, a combination of text and A values for the seven sweeteners reduced sweetness duration and overall perceived sweetness to a greater extent in low-temperature conditions than in acidic conditions. Overall, there were differences in the extent to which the sweetness characteristics of different substances were affected by different factors.
III. Classification of different sweeteners under 3 conditions


It can be found that the closest to sucrose in terms of sweetness dynamic release characteristics, both in acidic and low temperature conditions, is sorbitol, and steviol glycosides samples are a group in all three conditions because of their overall longer sweetness duration and therefore do not have similar dynamic descriptions to sucrose.
Fructose syrup, although similarly characterized to sucrose dynamics under ambient-neutral conditions, was nevertheless far from sucrose under ambient-acidic and low-temperature-neutral conditions; on the contrary, oligofructose was poorly characterized under ambient-neutral conditions, but was better behaved under the other two conditions, similar to sucrose.
Although the number of samples involved in the current study is limited, it is sufficient to reflect that the selection of sweeteners under different conditions requires not only static intensity analysis, but also dynamic assessment is an important reference for determining the suitability of sweeteners.
Source: Organized by Sensory Science and Assessment. Cover and article illustration source: Creative Post.
Reference: Jenjiao Han, Jinmei Bian, Caiyun Wang et al. Effects of pH and temperature on the sweetness release characteristics of eight sweeteners[J]. Journal of Food and Biotechnology, 2023, Vol. 42(5):1-11